Social Distancing Dashboard
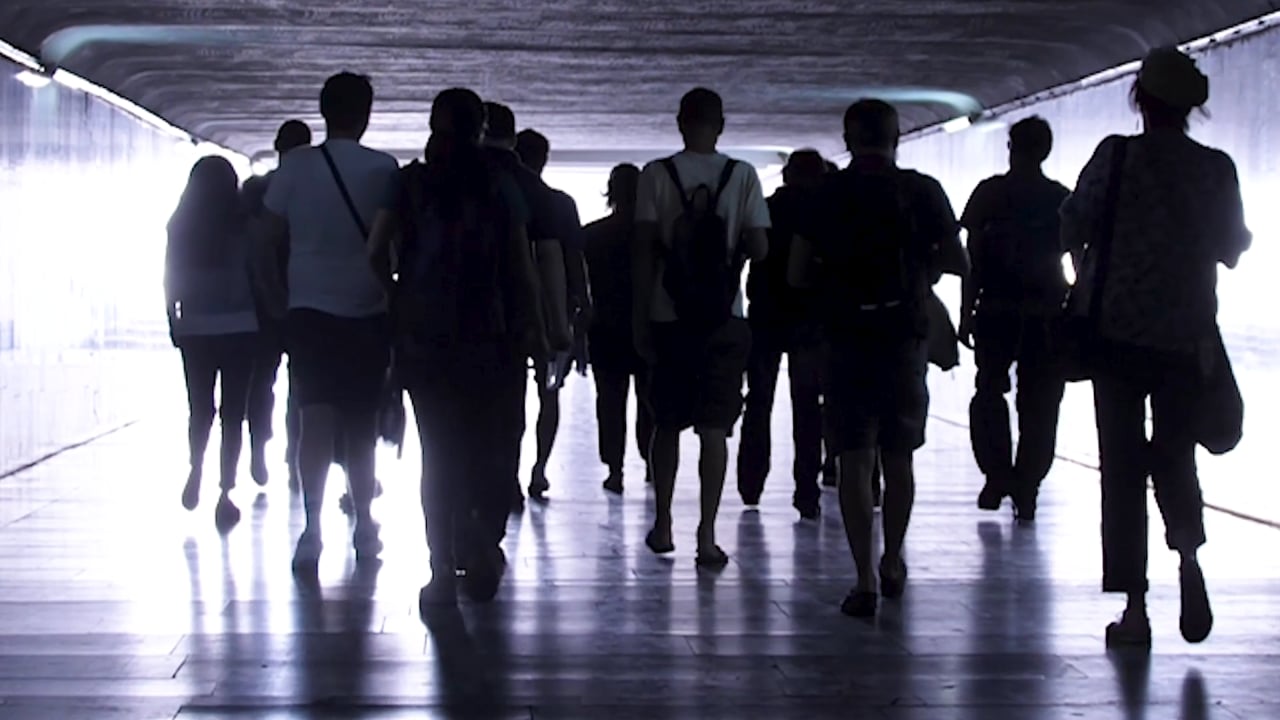
As we learn to live with COVID-19, society faces the difficult task of maintaining social distancing rules in practice. With growing numbers of pedestrians and cyclists returning to city streets, keeping a safe distance of 1.5m can be a challenge in many urban areas due to the way public space (or lack thereof) has been designed.
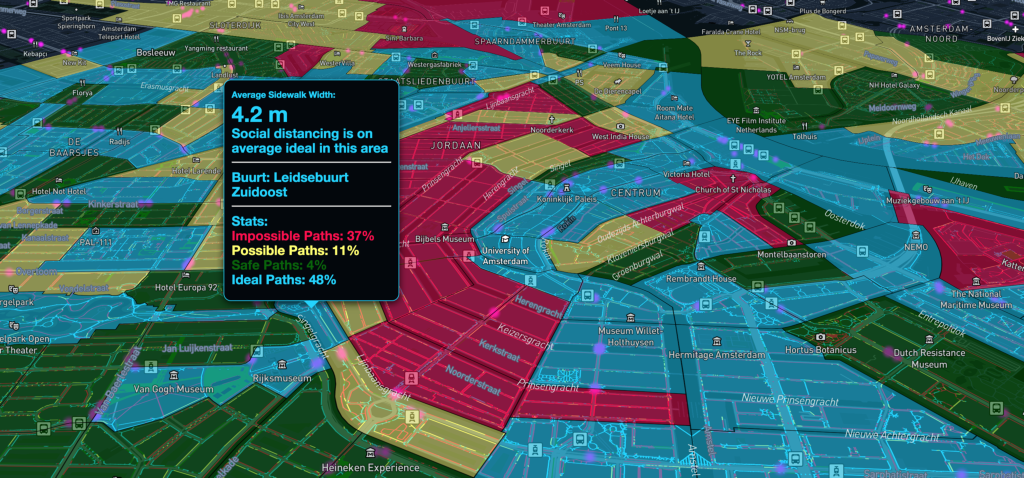
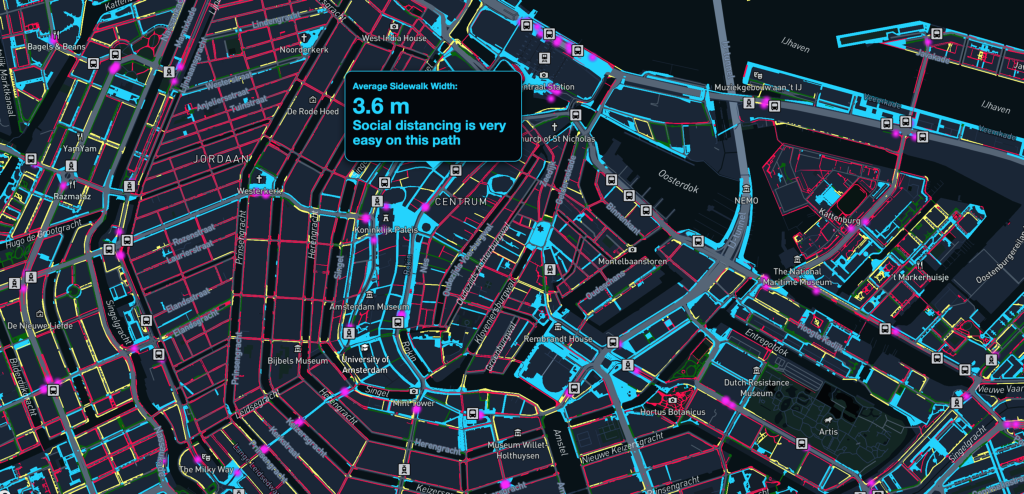
The Social Distancing Dashboard creates interactive city maps that show (on a street and neighbourhood level) whether social distance rules can be respected when moving in public space. It offers an overview of different factors – such as the width of the footpath and location of bus stops – affecting our ability to respect social distancing rules. In this way, it helps to raise awareness about constraints posed by the design of public space and contributes to decision making for COVID-19 related interventions in cities.
The dashboard fuses high resolution data from various public sources to estimate the width of footpaths and classify them according to a risk profile. The use of high-resolution datasets means that it is possible to perform analyses at different scales, ranging from street to regional levels. The dynamic and colour-coded maps are open access and available for use by policymakers, charged with making decisions on public health, for example, and city planners, tasked with making COVID-19 related interventions in the urban space.
The Social Distancing Dashboard aims to support policy makers in developing successful interventions in the transition phase of crisis situations, which will be local in nature and could possibly relate to specific economic sectors and commercial activities. The dashboard is also intended to raise awareness amongst city residents – especially those in risk groups – who want to navigate the city streets as safely as possible.
Given the urgent need for rapid responses to the current pandemic, it is worth noting that the dashboard was fully developed within 1.5 weeks. It has been taken up by several Dutch municipalities and covered on more than 25 Dutch and international media websites, including an article by the United Nations.
Share
Contacts
- -Achilleas PsyllidisView profile
- -Roos Teeuwen
- -Vasileios Milias
- -Carlo van der Valk
- -Alessandro Bozzon
- -Gerd Kortuem
Editions
Themes
Links
Official website | TU DelftDashboard | Amsterdam
Dashboard | Eindhoven
Twitter | SocialGlass
Twitter | AMS Institute