
Spying the Underground refers to the buried utilities that are often hidden from the eyes of citizens and city engineers. Since they are difficult to localize and measure from street level, utility plans are the only models that convey geometry information about them. Nowadays, Augmented Reality (AR) techniques allow us to display three-dimensional (3D) virtual utility models over a surface level camera image. To achieve this, 3D information needs to be added to existing utility models. Therefore, we developed a data model that allows storage of depth and geometry information. Based on this, we developed a fuzzy model that will visualize a fuzzy shape that indicates the uncertainty related to the location of each utility. We developed all this while generating 3D models for subsurface utilities at Oostplein Rotterdam.
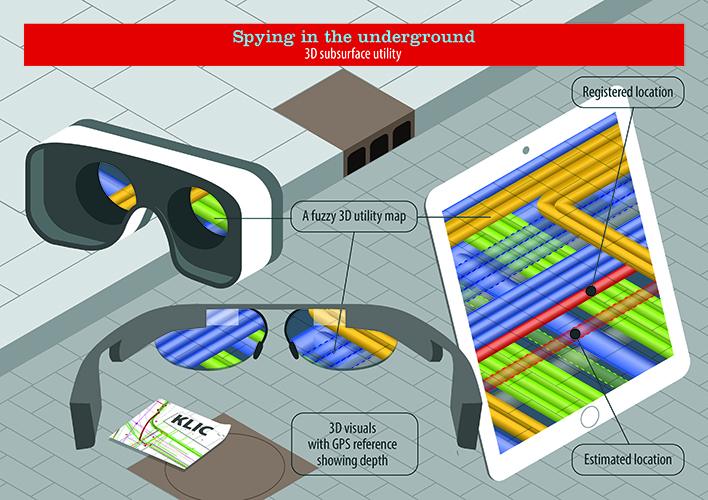
Three-dimensional utility infrastructure models enrich the spatial view on the subsurface and support the design, construction, and maintenance of networks. Although some geographical information systems (GIS) can store utility data in 3D, most existing utility plans are currently composed of 2D schematic lines. One reason for this is the absence of and uncertainty in available depth information of utility networks. With the use of limited additional location information, it is possible to already move 2D utility plans toward more accurate 3D models. This project, therefore, developed a 3D utility data model that uses various sources of available data to visualize location uncertainties. The resulting ‘fuzzy 3D utility model’ concept was tested in the field by implementing it in an Augmented Reality (AR) application.
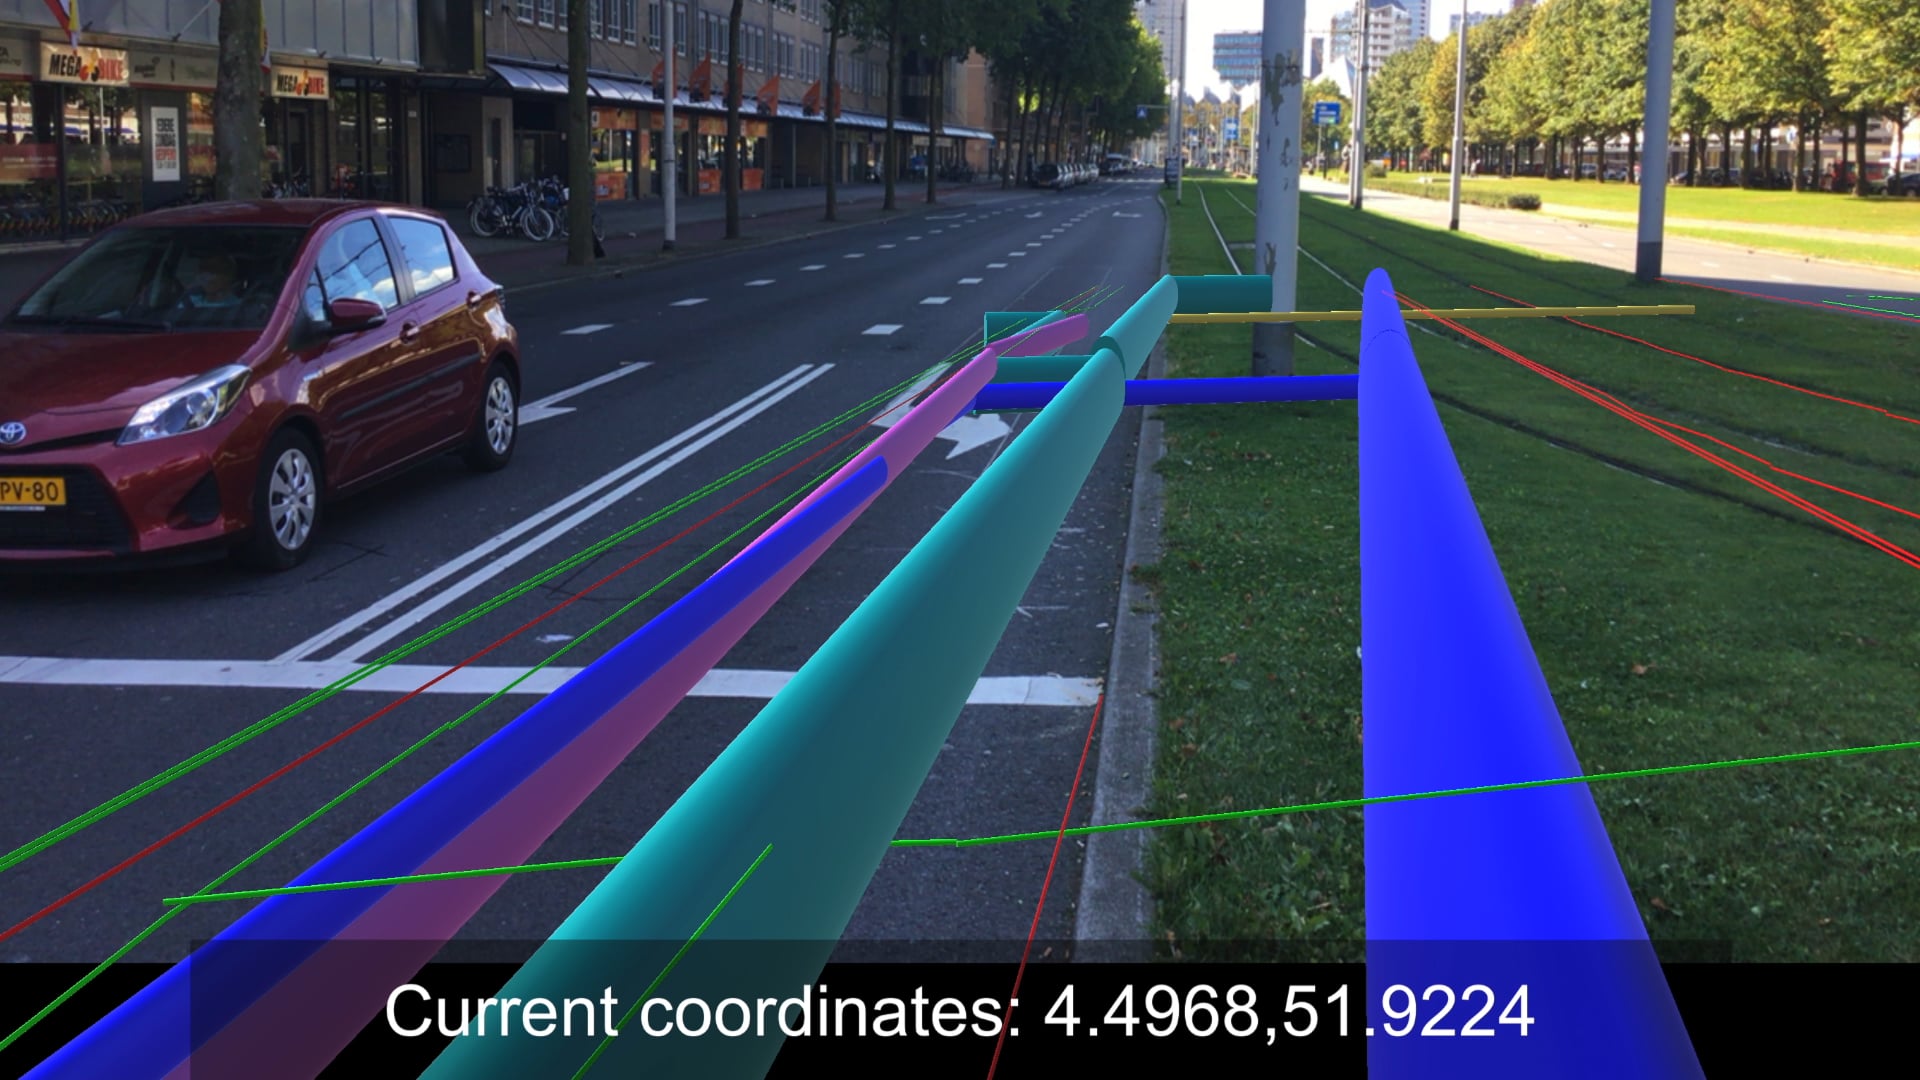
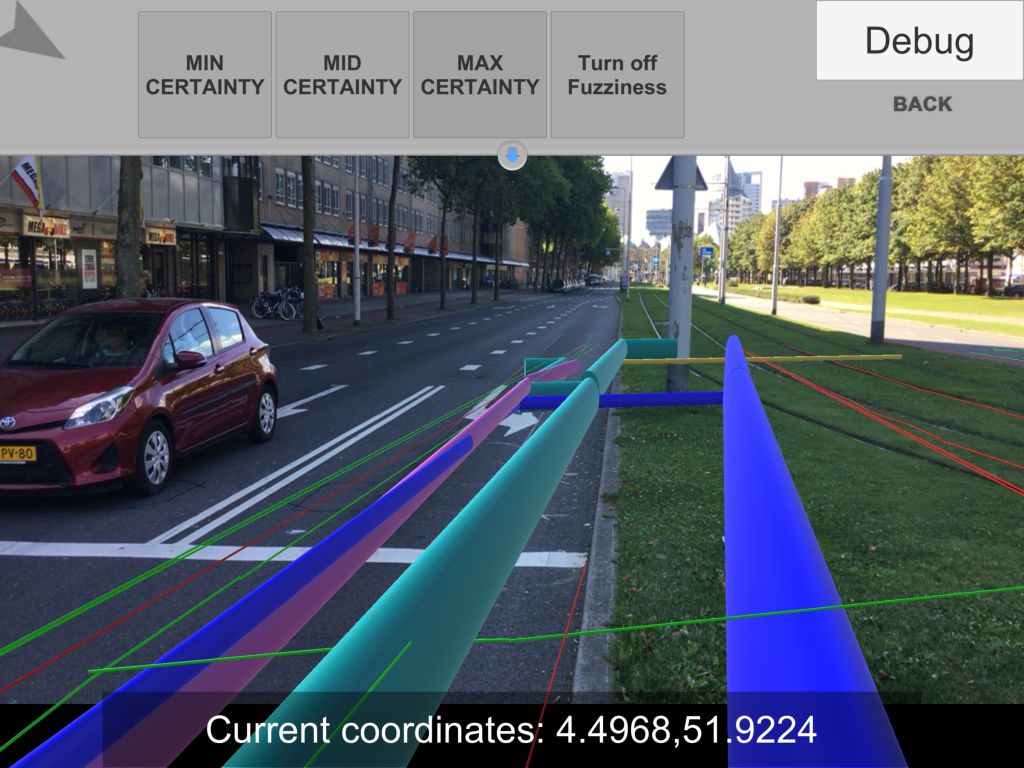
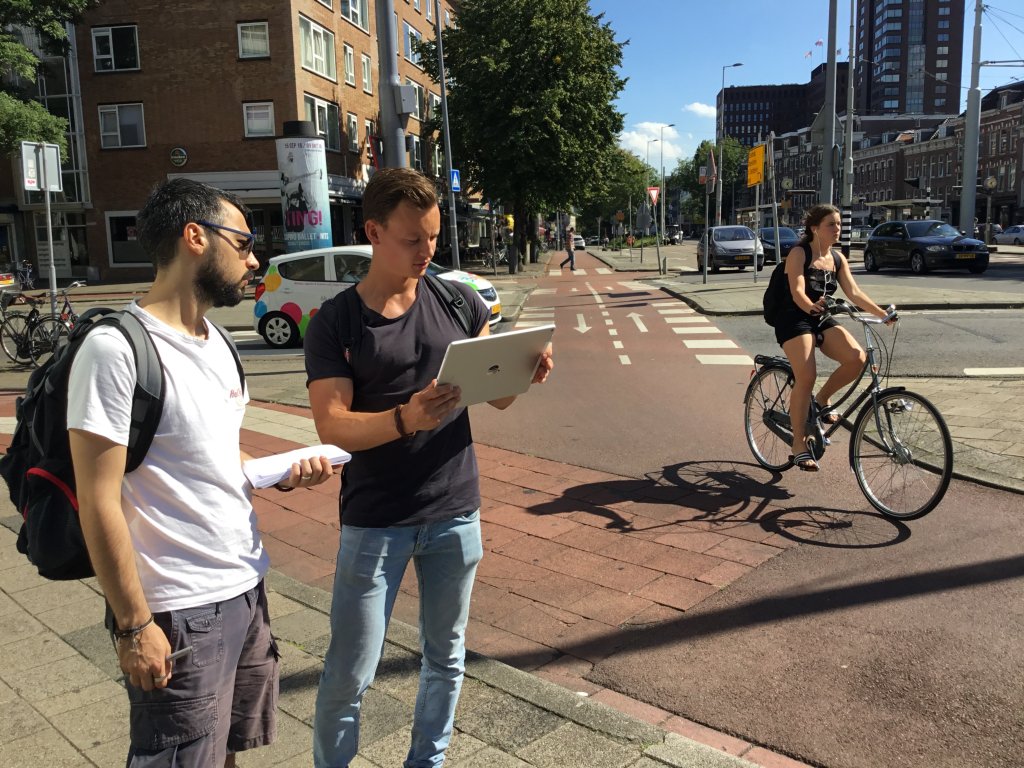
The resulting ‘fuzzy 3D utility model’ concept was tested in the field by implementing it in an Augmented Reality (AR) application.
For the proof of concept for our fuzzy 3D utility model, we analyzed the distinctive ways that are used in practice to store depth information. We consulted the people responsible for maintenance of the Rotterdam buried subsurface utilities, and we analyzed practical design guidelines such as the ‘Rotterdam Handboek Leidingen’. As a next step, we developed a conceptual model to describe subsurface utilities. We, therefore, extended an existing conceptual city model called CityGML Utility ADE. Software developer Recognize then helped us to implement this model in AR. This application was used to visualize the utility data of the Oostplein square in Rotterdam.
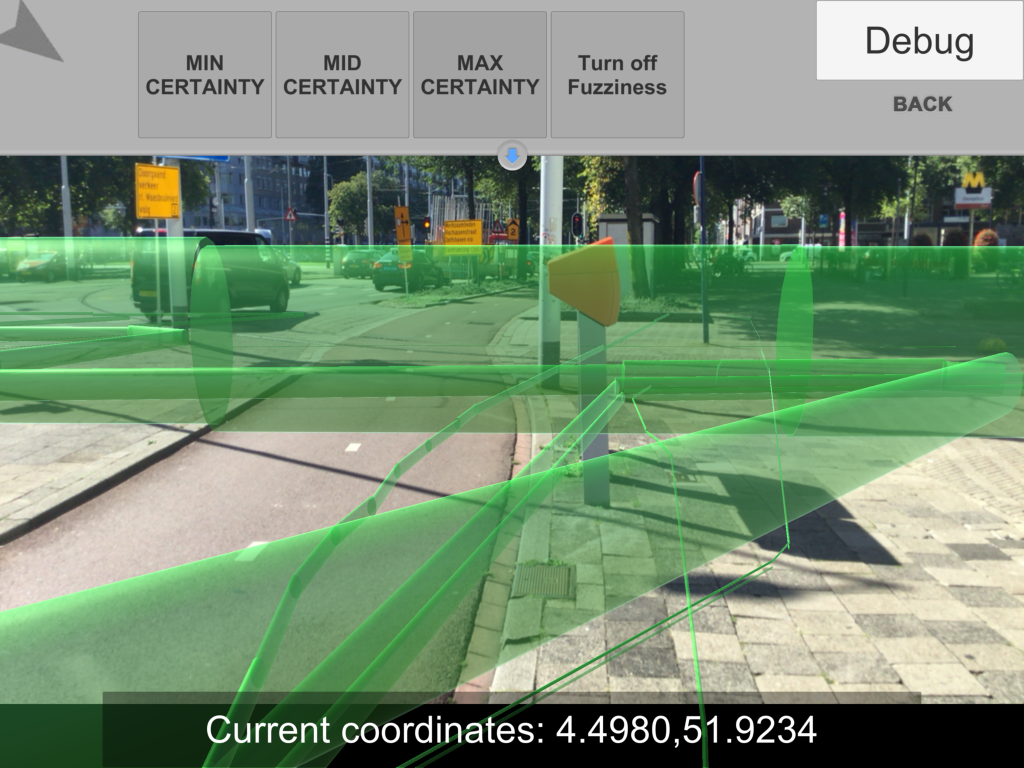
The developed model describes a utility network by using concepts such as network features and elements. The features describe, for example, information about the quality of location data. In turn, quality can capture location data by using attributes such as standard, estimated, and measured location. The values and reliability of the location attributes differ since 3D object locations are dynamic; i.e. they change over time when soil settles and cables move. Experts indicated that the registered location has a 5cm accuracy if a utility line is installed recently. Nevertheless, in some parts of Rotterdam, the ground may sink up to 1 cm annually. Such movement patterns are hard to generalize since soil conditions differ spatially. Experts judged that estimated locations can deviate from the real locations around 50 cm to 100 cm in all directions. In the prototype, we visualized these uncertainties by using a minimum, medium and maximum sized cylinder shape that enclosed the standard pipe geometry.
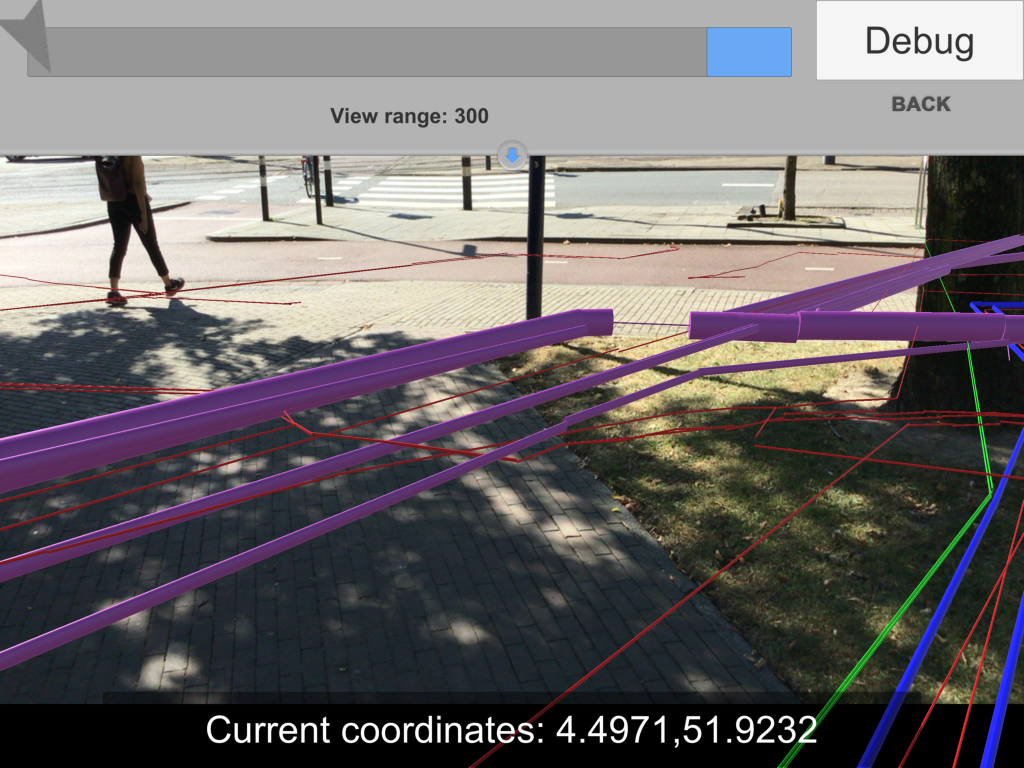
The existing version of the AR-application shows that fuzzy 3D models can be used to convey uncertainty information in utility maps. Three main technical hiccups need to be addressed in future research to further extend this application. First, the actual positioning of the AR-device is important to properly visualize the utility locations. Future research can explore how alternatives to GPS (e.g. LIDAR) can help to position the device more accurately in urban canyons where GPS signal is weak. Regarding the visualization of depth in AR, we also found that it most difficult to show the depth of a virtual object compared to a real-life image on the screen. Our current solution, using a scale symbol to indicate distances between pipes and the surface level, seemed not to be visible and clear. The third important step for future research concerns the visualization of the fuzzy shapes around pipe geometries. Currently, this shape is based on a fixed value for each pipe (having either a minimum, medium of maximum size). In future developments, it would be more realistic to let the size of the uncertainty shape be dependent on the reliability and overlap between existing location information about a pipe section.
All in all, this lighthouse project demonstrated a proof of concept for fuzzy 3D utility modeling in AR. The developed algorithm and UML model enabled the fuzzy visualization of three types of depth information (standard, registered, estimated). The first tests on the Oostplein revealed the first use cases and provided fruitful insights into the future development of the tool. Meanwhile, the product generated spin-off since Recognize was able to use the deliverable in projects for two new clients.
Team:
University of Twente
Léon olde Scholtenhuis
Delft University of Technology
Dr.-Ing. Sisi Zlatanova, Xander den Duijn BSc., Anna-Maria Ntarladima MSc., Evangelos Theocharous MSc.
Municipality of Rotterdam
Recognize