
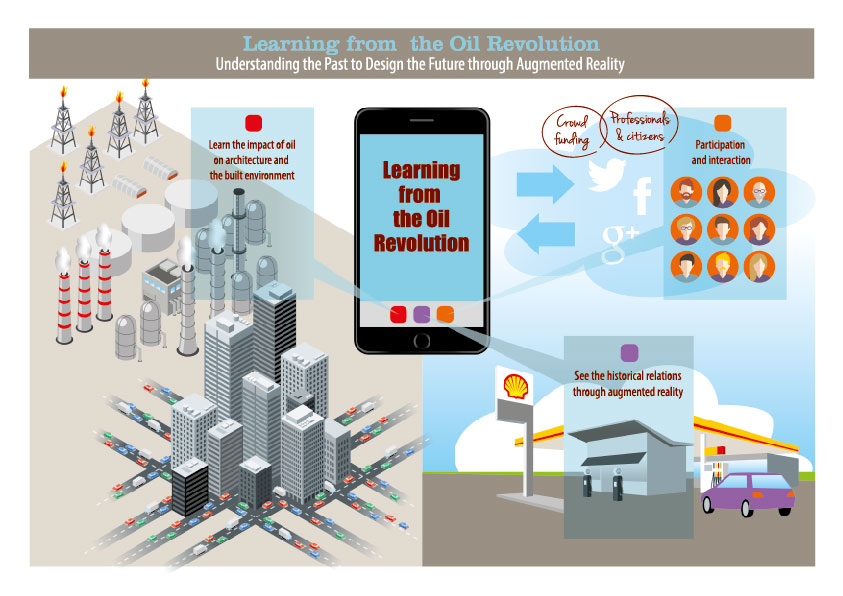
To understand the complex challenges of sustainable energy futures beyond oil and to meaningfully imagine new futures, we need to first understand the extent to which oil is part of our physical environment as well as our mindscapes. We have to understand the historical spread of oil-related industrial, administrative, and retail structures in conjunction with urban planning, policymaking, and architectural design. To help scholars and the general public track the history, location, and spread of petroleum in our built environment and to explore its impact on our spatial imagination and memory, we have devised both an open access webpage and an interactive augmented reality tool. Our case study is the Randstad and notably the Rotterdam/Den Haag area. Using an average smartphone (or tablet), users here can easily retrieve local information about oil and see it superimposed on their own landscape; they can also upload their own stories and information (citizen narrativesW) to the database. Viewers thus learn how oil infrastructure has shaped the urban form and function of the Randstad. We hope that they will also use these tools to think about the necessity to connect alternative energy futures with interconnected urban spaces.
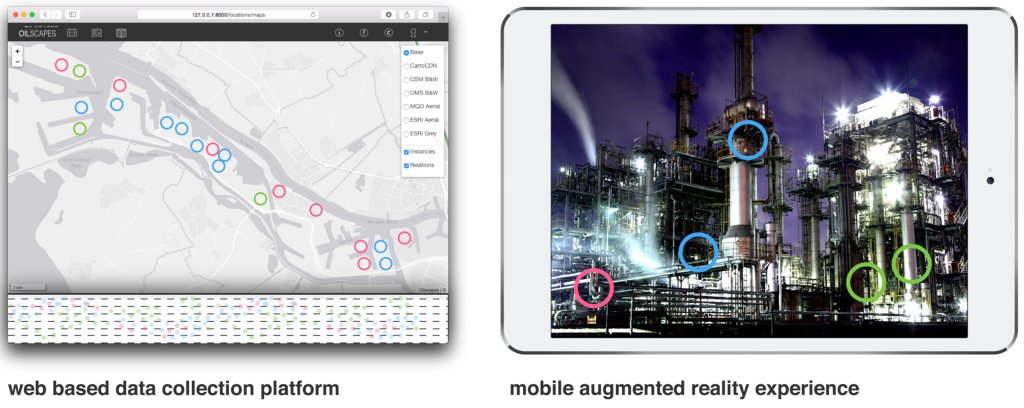
Current computing technologies allow us to connect our readings and interpretations of the built environment to extensive background information. We can retain research data, and comprehensively and coherently, superimpose the data on representations of the built environment. Viewers can directly see where the information comes from or what it refers to. Furthermore, it is possible to establish flexible connections between digital information and what we perceive in reality. Replacing fixed narratives laid traditionally down in written form for readers, these new tools invite viewers to discover or invent new narratives.
We have to understand the historical spread of oil-related industrial, administrative, and retail structures in conjunction with urban planning, policymaking, and architectural design.
The augmented reality tool adds three dimensions to what we perceive:
1. A historical viewpoint. It explains the tangible, physical building in front of the observer, revealing its background story: construction dates, alterations, or demolitions; why and how it was made in a certain way; the people involved in its creation and use. It traces the past through the present. Showing what was there before, it allows people to see how and why the built environment has changed.
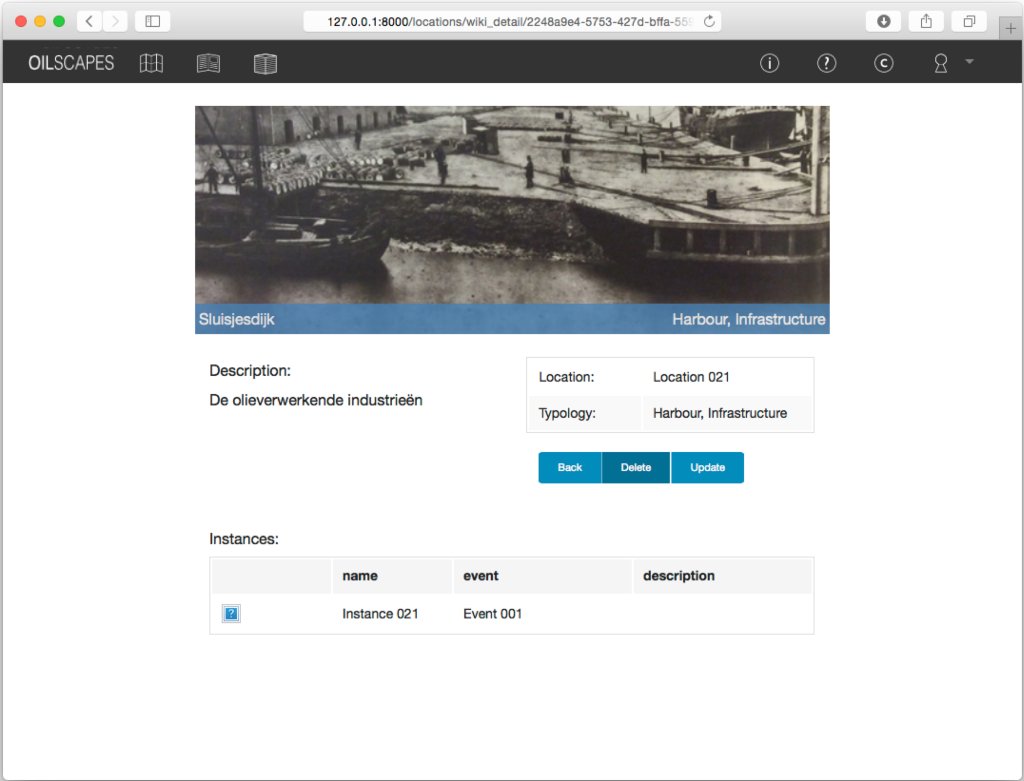
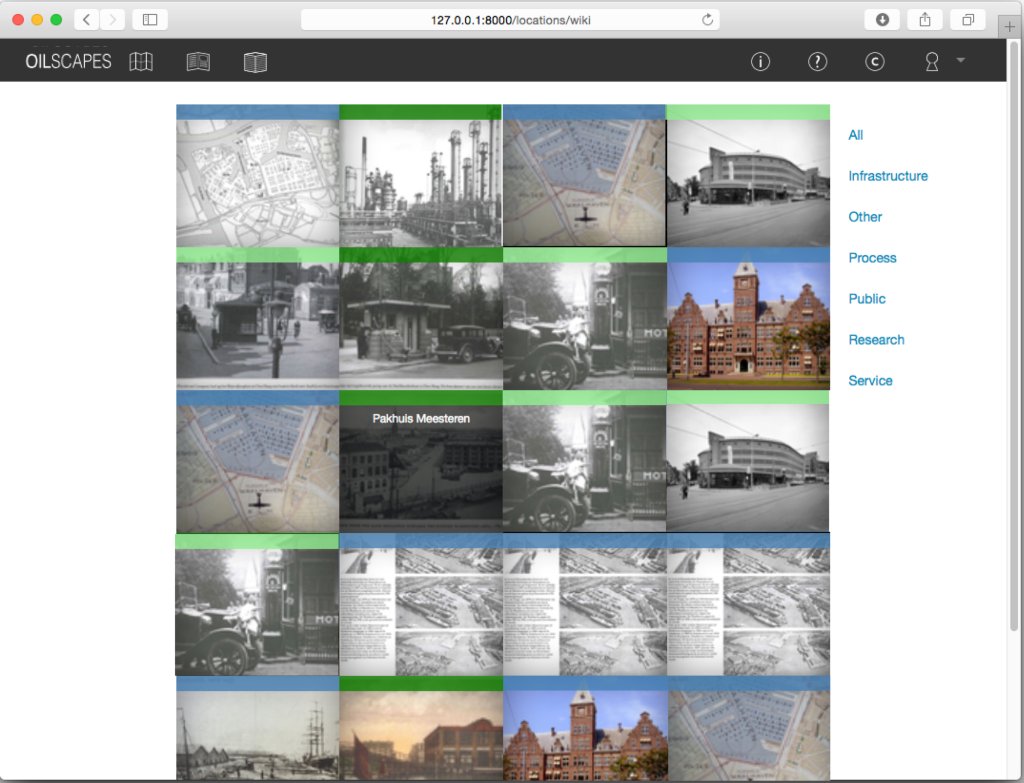
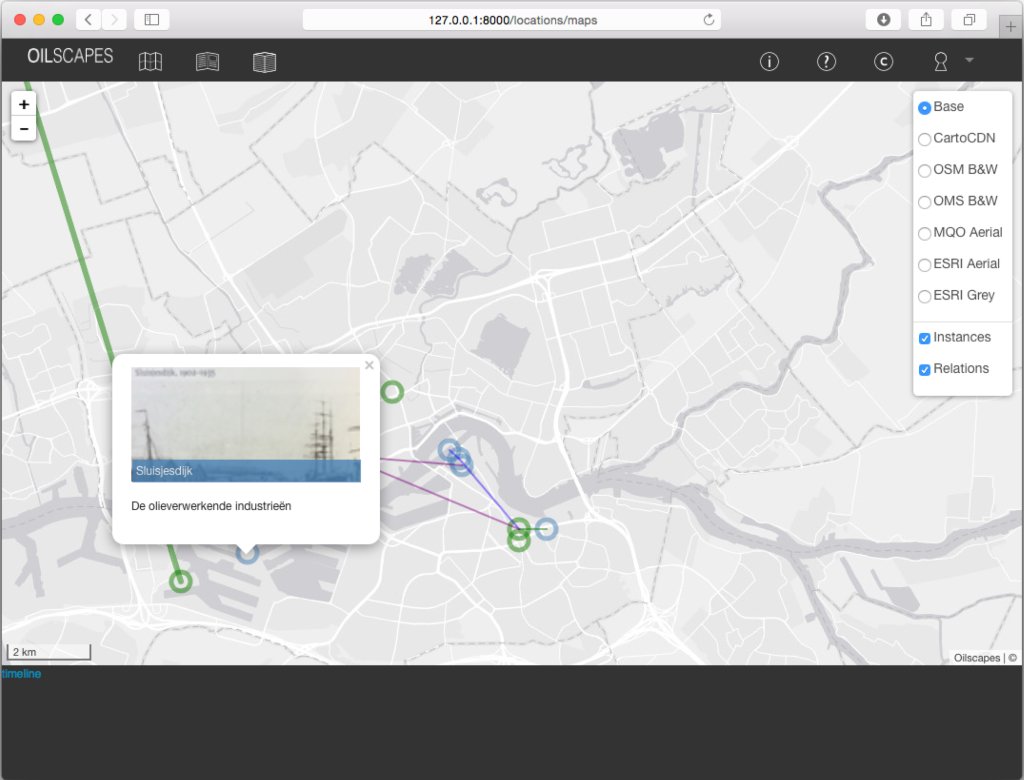
2. A citizen viewpoint. It makes visible the intangible - commodity flows, financial patterns, and human relations - linking the built environment to its wider uses. The augmented reality tool draws information from a website (www.oilscapes.com) that is itself part of our output; it gives us the opportunity to share research data with others, especially the wider public. Users can not only explore the data with the overview the site affords but also contribute to it by uploading their own data and stories.
3. A tourist viewpoint. It facilitates understanding of the physical landscape through a topical lens—such as energy—while also appealing to curiosity.
Such a tool must support a challenging combination of overview and detail, and let users make smooth transitions between views of reality and views of multimedia digital information. Even solving these problems, technical issues like the size of smartphone screens and viewing conditions can limit what viewers see. And there are human limitations too. Despite our familiarity with smartphones and daily interaction with their touchscreens, augmented reality is still largely new to most people. Many lack experience with the interfaces in question. So we have opted for simple interactions and a primarily visual digital content, with texts and diagrams playing a supporting role (e.g. for making transparent transitions from one item to another).
In an early stage we recognized that these challenges reach beyond the production of computer code alone, and the real trials lie in the user experience. Therefore the development of the interfaces followed an archetypical user-first idiom. We decided how to program and design the interface itself by making storyboard-like depictions of actions that viewers might take. We visualized the actual geospatial data with a small handpicked dataset, restricted in time and space: roughly 400 oil-related objects from the 1860s to1940 in the Port of Rotterdam and tested it with a small group of users.
These open access tools provide a unique opportunity for citizens, scholars and planners alike to comprehend the interconnected spatial and cultural aspects of petroleum and to imagine and promote alternative energy futures.
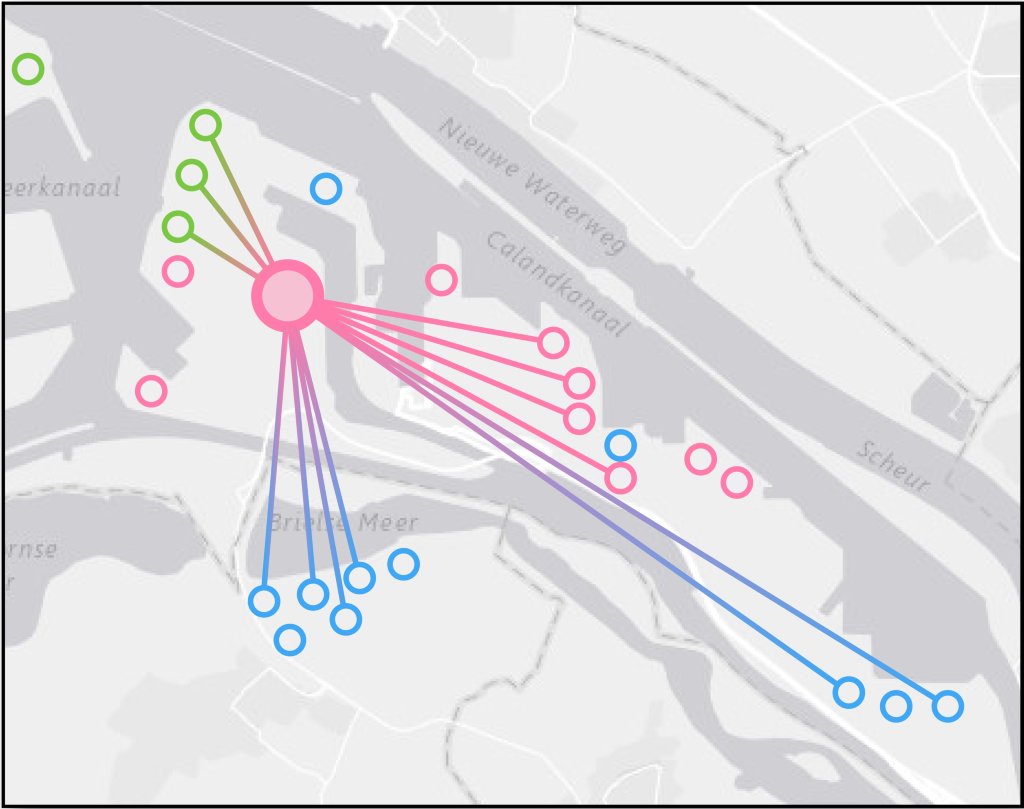
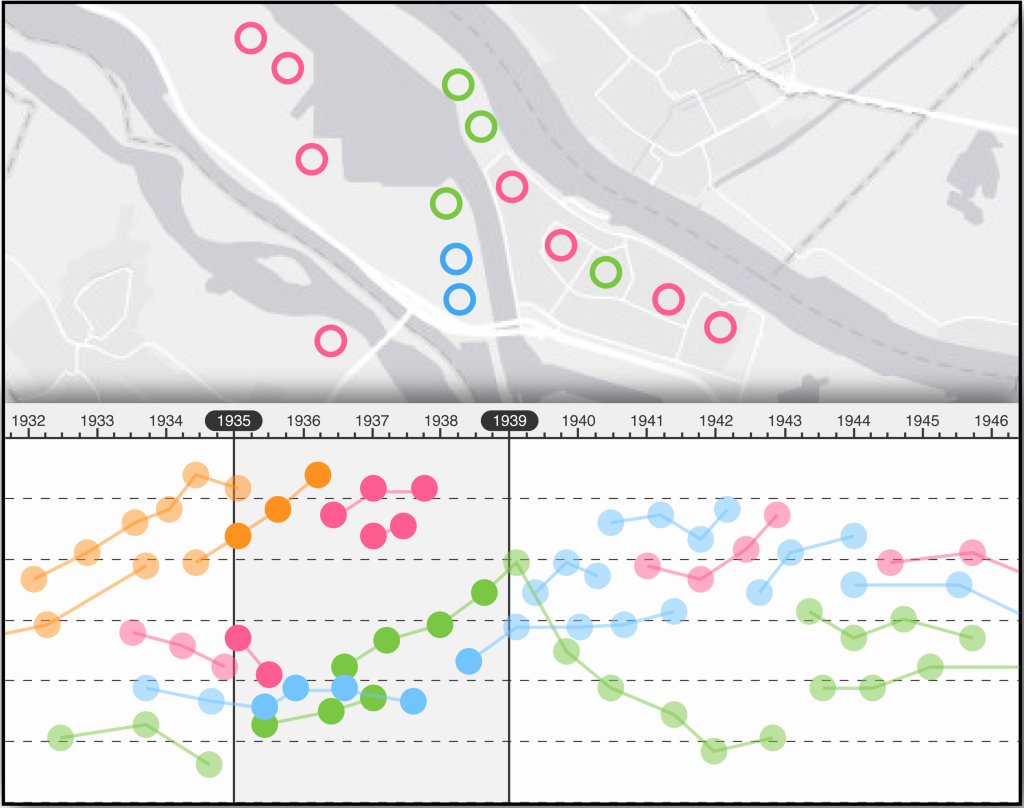
Then, based on this first experience, we enlarged the geo-temporal search-area to the greater Randstad region between 1860s and 2010, resulting in an updated collection of roughly 6000 historical objects. This time we employed several automated data acquisition strategies, mimicking the rather unbound workings of a crowd-sourced open data platform. In this stage, we realized that systematic cartographic prototyping of the augmented reality layers was needed in order to adequately display large and dynamic crowd-sourced geospatial data, and started closely collaborating with mapmakers at TU Delft. We all learned more about the concurrent and multidisciplinary use and enrichment of data; about color, iconography, and typography in mapping; and about typological groupings, levels of scale, historical time framing, geospatial clustering, and geometric representations. We used these insights to improve the tool, and are working with test users to finalize its design.
For now, the first version is available to the public. We hope that it helps users gain a fuller understanding of the ubiquity of petroleum in our built environment, and that such understanding will also lead us all to new approaches to sustainable and green energy networks, as well as to new approaches to heritage and its preservation. For example: Once petroleum is in our past, how will we contextualize oil-related structures such as headquarters or gas stations that are part of our heritage, even already added to the national heritage list? The oil pomp Jaknikker in Schoonebeek is already included in the register of national monuments, but will we “preserve” the networked heavily polluted industrial heritage of oil – the storage tanks, pipelines, and drilling platforms, and also the highways? These open access tools provide a unique opportunity for citizens, scholars and planners alike to comprehend the interconnected spatial and cultural aspects of petroleum and to imagine and promote alternative energy futures.
Project Team:
Delft University of Technology
prof. dr. ing. Carola Hein, dr.ir. Alexander Koutamanis, Ir. Seyed Sedighi, PhD., Ing. Lars van Vianen
Eindhoven University of Technology
prof. dr. Bernard Colenbrander, Ir. Femke Stout