4TU-AMI InterTU Studiedag 2016
Van interactieve video’s en blended learning tot aan modellering in het onderwijs en digitale eindtoetsen
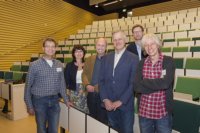
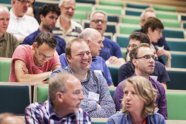
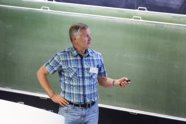
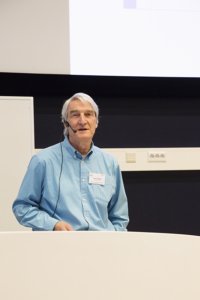
 Op vrijdag 24 juni 2016 vond de InterTU Studiedag plaats van 4TU-AMI. In Delft kwamen de wiskundedocenten van de technische universiteiten bijeen om kennis uit te wisselen en inspiratie op te doen van nieuwe ontwikkelingen in hun vakgebied. Ook de nieuwe TU-partner: Wageningen Universiteit, was aanwezig. Jaap Molenaar, hoogleraar toegepaste wiskunde, gaf een presentatie over de onderwijsvernieuwing op de Wageningse universiteit.
De studiedag voor wiskundedocenten in het service-onderwijs kent een lange traditie. Fons Daalderop, één van de organisatoren van de Delftse dag, geeft aan: ‘Het zijn elke keer weer leerzame ontmoetingen. Ik doe er altijd veel inspiratie op. En dit jaar is het voor het eerst dat Wageningen, als nieuwe TU-partner, ook is uitgenodigd voor deze bijeenkomst. Ik ben heel benieuwd naar hoe zij werken.’
Programma 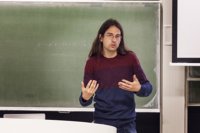 Het programma werd om 10.35 geopend door Fokko van de Bult, education fellow van de TU Delft. Gevolgd door uiteenlopende presentaties van de universiteiten. Zo gaf Universiteit Twente uitleg over de wiskunde track in hun honoursprogramma, sprak Delft over modellering in het onderwijs en werden de 4TU-AMI plannen voor blended learning toegelicht. De dag werd afgesloten met een presentatie van Jan van Neerven (TU Delft): ‘Can one hear the shape of several drums?’. Waarin hij de meest recente inzichten deelde over een eeuwenoud vraagstuk. Wanneer je op het vel van een trommel slaat, kun je dan aan de hand van de frequenties berekenen welke vorm het vel heeft? De conclusie van het verhaal: het is niet mogelijk. Van Neerven gaf in zijn boeiende lezing aan hoe je dit gegeven kunt aantonen.
Blended learning
Het onderwerp blended learning staat hoog op de agenda van de TU’s. Fons Daalderop en Matthijs Joosten, TU Delft, gaven de aanwezigen inzicht in hoe zij blended learning toepassen bij het vak lineaire algebra. Daalderop: ‘Deze manier van lesgeven geeft ons de mogelijkheid om de studiestof op verschillende manieren aan te bieden, zodat deze beter aansluit bij de diverse leerstijlen van onze studenten. Daarnaast kunnen we met onze software eenvoudig zien met welke opgaven studenten meer moeite hebben. Hieraan besteden ze relatief gezien, de meeste tijd. Vervolgens kunnen we tijdens de colleges extra aandacht besteden aan deze stof. ’
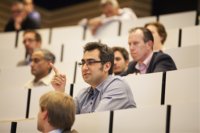
Digitaal toetsen 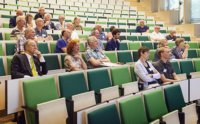 Steffen Posthuma, Universiteit Twente, gaf een interessante presentatie over digitaal toetsen. In Twente maken ze veel gebruik van de elektronische leeromgeving MyLabsPlus. Zijn universiteit onderzoekt nu of deze leeromgeving ook ingezet kan worden om eindtoetsen, geheel of gedeeltelijk, digitaal af te nemen. Een eerste pilot is uitgevoerd, maar moet nog geëvalueerd worden. Het onderwerp leidde tot een boeiende discussie.
Interactieve video
Alle universiteiten experimenteren met video’s. Hans Cuypers van de TU Eindhoven inspireerde de aanwezigen met zijn interactieve video’s, waarin hij directe vragen stelt aan de kijker. Hoe de video vervolgens verder gaat en ook hoe lang deze duurt, hangt af van de verkregen antwoorden. Op fascinerende wijze demonstreerde Cuypers zijn verhaal met een video waarin hij zijn publiek meenam in, op het eerste oog, een magische truc die uiteindelijk de 9-proef bleek te zijn.
Ook in Wageningen maken ze veel gebruik van video’s. Jaap Molenaar ging in zijn presentatie in op de pilot die vanaf 1 september aan zijn universiteit start. Als onderdeel hiervan wordt voor elk basisvak wiskunde, twaalf in totaal, een groot aantal korte videoclips ontwikkeld. Elke clip behandelt één vraagstuk. Molenaar: ‘Het innovatieproject is in het leven geroepen om een aantal redenen. In Wageningen hebben we te maken met grote groepen studenten met flinke niveauverschillen. Voor de een is de wiskunde te moeilijk, voor de ander te makkelijk. Onder meer zij-instromers hebben vaak een slechte voorkennis. Daarnaast constateren we in het algemeen dat studenten moeite hebben met het lezen van wiskundeteksten. Onder andere door de inzet van pre lecture video’s willen we de stof op een toegankelijke manier aanbieden en bemoedigen dat studenten thuis ook al aan de slag gaan.’
Dezelfde vraagstukken
Het was voor de eerste keer dat Wageningen deelnam aan de InterTU Studiedag en Molenaar kijkt met een goed gevoel terug. Hij geeft aan: ‘Het was voor mij niet de eerste keer. Jaren geleden, toen ik nog aan de Universiteit Twente en de TU Eindhoven werkte, kwam ik ook regelmatig naar deze bijeenkomsten. Ik vind het een goed initiatief. Dit is het enige forum waar wiskundedocenten in het serviceonderwijs elkaar ontmoeten. Zo’n 90% van het wiskundeonderwijs bestaat uit serviceonderwijs en er zijn veel mensen bij betrokken. Het valt me op dat we bij de 4TU’s met veel dezelfde vraagstukken bezig zijn, maar er vaak een andere invulling aangeven. Ik zou het van harte ondersteunen als we nog intensiever met elkaar zouden kunnen samenwerken.’

Mathematics and Big Data
 Big Data promises to revolutionize our lives and our industry. However, a major challenge is extracting sensible information from massive datasets, using current hardware, software and last but not least mathematical methods.
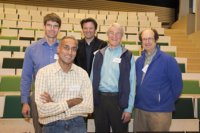
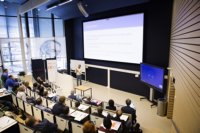
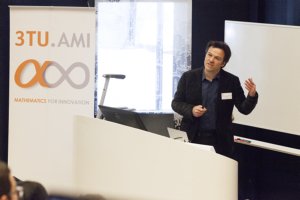
On Friday 8 April 3TU.AMI (3TU Applied Mathematics Institute) organised a workshop on Mathematics and Big Data with contribution of NIRICT (Netherlands Institute for Research on ICT). The event was hosted at the Faculty of Electrical Engineering, Mathematics and Computer Science (EEMCS) of TU Delft. Five renowned speakers from outside the three universities were invited to talk about how their research linked to Big Data. With 170 registered participants, the subject certainly struck a chord with the audience.
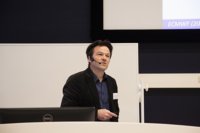
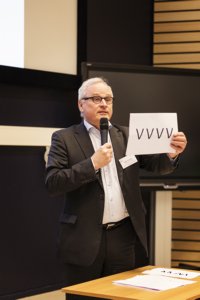 First on the stage was professor Rob Fastenau, dean of the EEMCS Faculty and chairman of the 3TU.AMI institute. He asked the audience, who are in the lead with Big Data? Is it electrical engineers producing more and more transistors and storage capacity? Is it computer scientist, who think they are the masterminds of processing data? Fastenau believes that mathematicians are at the heart of getting value out of Big Data.
Fastenau stated that we need to cherish the role of mathematicians in Big Data and that we need to speak out on that role, which was of course at the centre of the workshop. Referring to IBM’s four V’s of Big Data: Volume, Variety, Veracity and Value, he remarked on the use of Big Data in education. According to Fastenau, the amount of data you can get from students is impressive. You can even check before the lecture if they have watched the preparatory videos. He then performed a small trick on the four V’s and transformed them into WW, which in Dutch stands for mathematics (‘wiskunde’). He concluded that with such a relatively simple transformation you get mathematics, and that illustrates the value of maths within Big Data.
Daniel Boley: Optimization in machine learning
 First of the keynote speakers was Professor Daniel Boley. Daniel Boley obtained a PhD in Computer Science from Stanford University in 1981. He has since been on the faculty of the Department of Computer Science and Engineering at the University of Minnesota, where he is now a full professor. (see slides)
Professor Boley talked on the role convex optimization plays in Big Data. Looking back over the decades he sketched the history of sparse representation dating back to the 1970s. Looking forward he concluded that optimization has an essential role to play in Big Data, and that convergence guarantees is still a very active research area.
Data comes in different forms and structures, from text documents to gene expression profiles to network data representing social transactions. The goal of processing these data with machine learning is to see the underlying significant patterns underneath the noise. There is a lot of interest in sparse representation as a way of generating a low complexity representation of data samples, with fewer features or fewer samples that can represent the entire dataset, and that can expose patterns that remain otherwise hidden. Statisticians see Big Data as a branch of statistics, computer science as a branch of computer science, electrical engineer ditto. They are probably all right in their own way, but convex optimization plays an essential supporting role in Big Data.
In sparse representation you seek to represent each data sample as a combination of as few dictionary items as possible. Sparse representation dates back to the 1970s when geophysicists who were looking at seismic events, realized that l1 regularization (least absolute deviations) worked on earthquake data. This early work was based on empirical observations only. The subject was picked up again in the 1990s by statisticians who used it for formal analysis. It has since exploded in a large literature base, of which Boley confessed to be guilty of contributing a fair few articles. The idea of approaching this as an optimization problem dates back to the noughties. LASSO (least absolute shrinkage and selection) is a commonly used method for solving sparse approximation problems.
Boley presented a number of variations on the sparse model, such as the group lasso, where instead of looking at individual components, these are grouped. This could be useful, for example, if you want to predict multiple climate variables based on climate variables at a small number of locations (e.g. if getting the data is expensive). The fused lasso is a popularly used method in image processing, whereas matrix completion is used, among others, in movie recommendation systems. Although a lot of optimisation methods have been developed, there is no one norm that is the best; it all depends on the level of sparsity that is wanted.
When you are talking about large data collections, second order methods become intractable, so you should stick to first order methods. Some popular methods are: ADMM (alternation direction methods of multipliers), F/ISTA (fast shrinkage/threshold algorithms), and CD (Coordinate Descent). Boley has been working on the local convergence of some of these first order methods, which are proven to be globally convergent, but the rates of convergence are rather weak. In one example presented, Boley applied ADMM on a Linear Programme. This proved to be interesting not just from the point of view of demonstrating ADMM, but it was also relevant to the Warburg effect. In some cancer cells, a mix of fermentation and respiration is used to get energy to the cells. It is not clear why the cancer cells do not use either one or the other. The linear programme offered a simple explanation for that characteristic.
In general, convex optimization has become a big field because of the volumes of data involved. You need scalable methods for convex optimization problems. This has generated a lot of interest in effective first order methods to solve them. Convergence guarantees offer a very active area of research of which we have only scratched the surface.
Tony O’Hagan: Uncertainty Quantification Inversion of Large Models
 Professor Tony O’ Hagan began his academic career at the University of Dundee in 1973, moving to Warwick University in 1975. He became Professor of Statistics at the University of Nottingham in 1990. He has been a Professor with the School of Mathematics and Statistics (SoMaS) moved to Sheffield since 1999. (see slides)
Uncertainty quantification is a bit of a buzzword that has been going around for a few years now. This means there is a lot of funding to be had, and this has spawned a lot of work. Although quantifying uncertainty is quite a new concept in applied mathematics, engineering and other fields, as a statistician it is O’Hagan’s raison d’etre. Nobody is ever going to find a cure for uncertainty, so he is not likely to be out of a job soon, O’Hagan joked.
Complex simulation models are used to make predictions for real-world situation. Since all models are imperfect, how might a simulator output ‘y’ differ from the real world value ‘z’? This could be due to input errors, but also to model structure errors. Or we may think we know all of the science when we don’t. More often we can’t put all the science in, or the model becomes unsolvable. That is why we work with approximations and simplifications. As computers get more complex, we put more and more detail into our models, yet there is always more to add. Nevertheless, modellers are unlikely to admit the imperfections of their models, unless you offer them more money to improve them.
Simulations are often computationally expensive to run; this can take from hours up to years, meaning they do not get evaluated often. However, if you want to understand uncertainty, you have to try out different variations and try out different values of the uncertain parameters. The ideal solution would be to provide a probability distribution for ‘z’ for the true-world values.
‘Managing uncertainty’ is another phrase that is coming into fashion. O’Hagan is a member of the Uncertainty Quantification & Management (UQ&M) special interest group aimed at high-value manufacturing. Managing uncertainty means not just quantifying uncertainty, but understanding the implications of different uncertainty sources. With the help of sensitivity analysis you can determine which uncertainties contribute the most to the uncertainty in ‘z’.
The best way to reduce uncertainty is to get more information. You can do this informally, e.g. improving your model and your understanding of the inputs may help you tighten the probability distribution. It is better to do these things mathematically, using real-world data and process them through a statistical analysis. Key to this is calibration or inversion: using the data to learn about the uncertain parameters in the model. We also need to learn about ‘z-y’, about the structural error in the model, since we do not observe ‘y’, but ‘z’. That will help us understand the difference between what the model says and what reality is, so that we can validate our models as being good enough when the structural error is small enough.
In statistics all sorts of uncertainty are studied and can be addressed, usually uncertainties that other people have not thought of yet. MUCM (Managing Uncertainty in Complex Models) was a research project concerned with issues of uncertainty in simulation models. On www.MUCM.ac.uk you can find a lot of information on how statisticians deal with uncertainty, including an MUCM toolkit.
Inversion is when observations in the real-world system are used to learn about model inputs. When you have imperfect models, inverting them is a real issue. Tuning parameters are not the problem here. Inverting, or calibrating, a wrong model gives parameter estimates that are wrong, which is a problem for physical parameters. In more complex models it is harder to see what is going on, hence it is harder to see you are getting it wrong. Big data can also fool you into thinking you are getting it right. For extrapolation, predicting reality outside your range of observations, model discrepancy is a huge problem. The better our prior knowledge about model discrepancy, the more chance we have of getting the physical parameters right.
Michel van den Broeke: From hindcast to forecast.
 Michel van den Broeke is Professor of Polar Meteorology at Utrecht University. He studied Meteorology and Physical Oceanography at Utrecht University, where he also obtained his PhD in 1996. Between 1996 and 1998 he worked as a Research Associate at the Norwegian Polar Institute, Oslo. (see slides)
Professor Michiel van de Broeke wowed the audience with his colourful presentation, featuring satellite images and CO2 emission hindcast animations, rather than complicated equations. He also showed how accurate the weather predictions for D-day had been, under what we now call primitive conditions. However, he warned that sea levels do stand to rise by several meters. Fortunately, that will still take a few thousand years.
Weather forecasts improved impressively over the last few decades, and even ten day forecasts are becoming useful for many applications. Improved physics at the basis of this, although subjects like microphysics in clouds, e.g. aerosols, are still largely uncertain. Higher resolutions have also helped: where forecasts used to be on a 100 kilometre grid, this is now 10, and will probably be 1 kilometre in another ten years’ time.
Improving resolution comes at a huge computational cost, but up to now improved computer power has kept up with this development. However, power consumption is a challenge. Nowadays we don’t run a single forecast, but we run 50 forecasts simultaneously – ensemble forecasts – to quantify uncertainty. The atmosphere is chaotic, small perturbations thousands of kilometres away can hugely impact weather predictions for over here. Hence, accurate predictions for a period longer than 3 weeks are an impossibility.
The quality and quantity of observations play a big role also. Nowadays, satellites fill huge gaps in observations over the oceans and other inaccessible areas. Speaking of the quality of observations, radiosondes are launched in helium filled balloons to measure the vertical profiles of temperature and wind etc. in the atmosphere; these are actually small computers. Nevertheless, tens of thousands of data observations and measurements get lost daily for various reasons.
Hindcasting means going back in the past with the best model that is available now and re-predict the weather, re-analyse the atmosphere using the most recent techniques. A whole new class of climate research has sprung up around this method, and a lot of centres are working on this. These centres offer four-dimensional views of the most important variables over certain periods of time. What can you use this for? For instance, look at the weather on D-day, 6 June 1944. At that time, they had almost no data available, and still they made very accurate predictions. This proved how good people were at that time with limited means. Or look at the Keeling curve, giving CO2 concentrations in the atmosphere over the year. In the Northern hemisphere you see strong seasonal cycles here, which you can study with the help of hindcast. Another interesting application are chemistry transport models, with which you can e.g. analyse NO2 produced by combustion engines.
So how about ice? You can use hindcast to check the predictions that the IPCC made in 1990. In 2009 a group of scientist compared these predictions with actual observations. The IPCC predicted a sea level rise of about four centimetres, with an uncertainty margin of 50%. Observed sea level rise was six centimetres, so just within that margin. In 1990 we didn’t yet know that ice sheets are losing mass; that is a source of sea level rise that the report missed.
Since then, the melting of the ice sheets has been derived from gravity readings by the two GRACE satellites. But what causes the mass loss in Antarctica? We need to know this in order to predict it. There are three candidates: less snowfall, increased melt, or increased ice flow. It is not increased melt as temperatures are too low, so we need to quantify snowfall and ice flow to see what is going on. Ice flow velocity we can observe from space, and ice thickness can be measured from airplanes with powerful radars. But how are we going to determine how much snow fell on the ice sheets over the last thirty or forty years?
Poorly sampled regions cannot be captured by inter- or extrapolation. So that is where we combine regional climate models, specific for Antarctica, forced at the boundaries by re-analysis data. Comparing ice flow with fall of snow, we conclude that there are regions with more outflow of ice than fall of snow. These are the areas where you would expect mass loss, and this is also what the GRACE satellites detected. The loss of ice is also accelerating. This is caused by the oceans, not by the atmosphere. As the ice shelves retreat, more water flows under the floating icebergs, increasing melt. The bedrock in West-Antarctica is below sea level, so that particular ice cap cannot retreat to higher ground, only further inland. Based on the hindcasts and observations, we can now predict that the ice sheet will disappear completely and as a result, global sea level will rise by 3 metres, but this will take thousands of years.
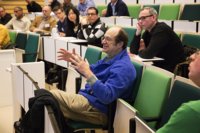
Prabhakar Raghavan: Three results on recommendation systems
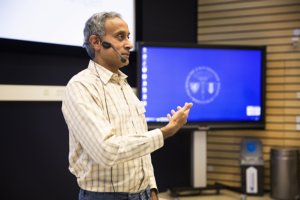 Dr Prabhaka Raghavan is a Vice President of Engineering at Google, having worked at Yahoo! Labs and IBM Research prior to joining Google. Raghavan holds a PhD in Electrical Engineering and Computer Science from the University of California, Berkeley, and a Bachelor of Technology from the Indian Institute of Technology, Madras. (see slides)
Prabhakar Raghavan has been interested in the nexus of computation and the social sciences for the past ten or fifteen years. He is especially interested where microeconomics are concerned. What happens if people interact with computational artefacts? Although he set out to talk about 3 or 4 pieces of work in this area, he is delivering less than he promised, he jokes, having decided to talk in-depth about one result in recommendation systems.
A central feature of a recommendation system (RS) is that the items users buy depend on the purchases made by other users before them. The simplest example just tells you of prior purchases. Showing the number of times a song has been downloaded can distort the rate at which people listen to songs, as has been shown in a classic RS experiment. Work into RS is motivated by such questions as: to what extent to recommendations disturb the consumption of items in the market? RS are used by companies to make you buy more, or to read more stories thus generation advertising income etc. However, if all goes well, the users themselves also get value from a RS as they get recommendations that they value and trust.
The formal study of RS is growing from many perspectives. For example, in the machine learning community, there is a lot of work going on in matrix approximations and reconstruction as mechanisms for filling in your affinity for products you have not purchased in the past. In the microeconomics community there is a lot of work going on in user metrics, e.g. by synthetically creating some notion of user happiness, for example the long clicks on news stories, and then instructing the RS to maximise user happiness. A lot of controlled experiments of recommender algorithms are also taking place. There is now even a yearly Association for Computing Machinery (ACM) conference on Recommender Systems.
Raghavan describes what he calls a fairly nice clean model to capture the phenomena of a RS. In this model, every user has prior purchases and also a frequency or buying rate. A user also has a preference distribution over the products, e.g. toothpaste will be purchased more often than cars. With an RS at work, this distribution will change. However, a user will only consult the RS in some cases to determine what to buy. The rate of trust also plays a part, as the opinion of a wine expert for example, will be worth more to the potential buyer than just anybody’s opinion. A natural condition in the model is that the past fades away. A single item purchased a long time ago, is not really significant, though it may take different lengths of time for different products to be forgotten.
Does the kind of market distortion, as shown in the RS model, really happen in practice? To research this, Raghavan and his colleagues took several public data sets from Google+, Yelp, Facebook etc. consisting of large weighted graphs. For each of these they set about running a RS and setting up a number of experiments. In an attempt to try and really distort the market, they set the rate at which the users referred to the RS at 0,2 which is abnormally large. Raghavan claims that you don’t ask your fiends for 20 per cent of your purchases, it is probably far less. It turned out that it was really hard to distort the market. The biggest distortion they achieved was in the Twitter network. Perhaps not surprising, sinceTwitter is a network where people try to maximise their influence. Especially when a networks evolves around an oligarchy, think Beyoncé, you can engineer distortion.
Experiments suggests that real social networks dampen the influence of RS. It is critical to understand this. In the social sciences, there is currently concern that algorithms are taking over and we are going to buy things we would not buy otherwise, or read stories we would not read otherwise, in a phenomenon called the filter bubble. However, although you can theoretically calculate this distortion, it is very difficult to engineer. Because of the way humans are structuring their relations, it is very hard to let computers take over.
David Dunson: Probabilistic inference from big and complex data
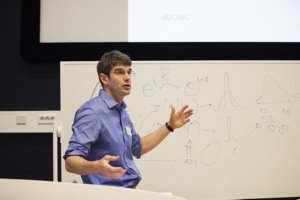 Professor David Dunson obtained a PhD in biostatistics from Emory University in 1997. He is a fellow of both the ASA and the Institute of Mathematical Statistics. He was named full professor in the Department of Statistical Science at Duke in August 2008 and appointed Arts and Sciences Distinguished Professor of Statistics in May 2013. (see slides)
Dunson’s main interest lies in working with scientists on ways to analyse Big Datasets, building probability and mathematical models for these data. This could be astrophysics, or biomedical data, anything really large and complicated. Yet despite the huge interest in Big Data in the statistics, mathematics and computer science communities, there has been hitherto a narrow focus on methods for analysing Big Data. Unfazed by problems with the sound system, Dunson made ample use of the whiteboard for his equations, quipping ‘this is a maths workshop, right?’
So far, a lot of attention has gone on penalized optimization methods. Also, the focus in Big Data research has been on very specific settings: there has been a lot of interest in big matrices, and there has been a lot of excitement about deep learning algorithms for identifying objects in images. Over time a lot of the work starts looking rather similar, due to this bandwagon effect, while there are many areas that haven’t been touched.
Like Tony O’Hagan, Dunson talks on trying to characterize uncertainty with probability models. Can we design general probabilistic inference algorithms and test them out for a wide variety of modelling settings? Also, we want to be able to scale the algorithms to large amounts of data. For this, we need to characterize uncertainty accurately, and the robustness of inferences is equally crucial: no tweaking allowed. Dunson focusses on Bayesian approaches, as these provide a niche machinery for characterizing uncertainty in modelling big, complicated data.
In practical settings, working with very large social science datasets, or computational advertising data, posterior distribution has proven to be a problem, as analytical approximations are not very accurate. Markov Chain Monte Carlo (MCMC) and other posterior sampling methods are the solution here, with the MCMC algorithm being the absolute gold standard. Many statisticians working on this ignore the fact that we do not have the ability to compute this posterior distribution. Dunson likes to address this gap by looking at how we can compute posterior distribution with some approximation in high dimensions.
How can we scale up these MCMS algorithms in big and complicated settings? Two issues that are driving computational efficiency here are the time per iteration and the mixing of the Markov chains. Also, for Big Data we cannot compute everything on one machine, and as MCMC algorithms are inherently serial, they are not suitable to break up computationally over lots of different machines. A solution could lie in using a robustification of the posterior which allows for faster computation for essentially coarser data. Another option is to use fast optimisation algorithms for some of the parameters and use sampling for the rest. Or breaking up the data in different chunks, running MCMC on different machines and then somehow combining the results. That is known as embarrassingly parallel (EP) MCMC.
With EP MCMS you divide large sample size data set into many smaller data sets stored on different machines. Then you can run some version of MCMC and obtain posterior samples for each subset. But how to combine the very noisy subsets resulting from this to get a good approximation of the posterior on all the data? Dunson shows how to solve this with the help of stochastic approximation, using a combination of WASP (WAsserstein barycentre of Subset Posteriors) and PIE (simple and fast Posterior Interval Estimation). Dunson and his colleagues have tried this approach for a rich variety of data and models, including logistic & linear random effects models, matrix & tensor factorizations, Gaussian process regression, and hierarchical models. It has turned out to be a highly accurate method that is much faster to run than MCMC.
Another approach he proposes is to replace expensive transition kernels with approximations when running into computational bottlenecks. This approximate or aMCMC is already used routinely in an ad hoc manner. But what really happens here? To find this out, Dunson designed an exact aMCMC algorithm with good mixing properties for theoretical purposes, that never has to run (and might even be intractable). Approximating that exact chain with some easy-to-approximate transition kernel led to a theory that characterizes the trade-off between computational complexity and statistical performance. Dunson was able to verify his theory for several examples. He expects this will aid the design of new algorithms that optimise this computational time-accuracy trade-off. Dunson would also like to see more people working in this area.
Boudewijn Haverkort: Commit2Data
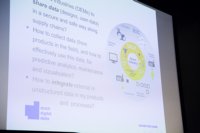
 Last speaker of the day was Boudewijn Haverkort Professor of computer science at Twente University. He is also chairman of the Commit2Data initiative. He promised the audience no more equations, inferences or extrapolations. Instead, his talk entails an invitation to take part in the Commit2Data programme. (see slides)
ICT research is doing very well in the Netherlands. A recent research assessment of all computer science departments in the Netherlands gave a verdict of ‘world-class’. The estimated value of ICT to the Dutch economy amounts to 26.5 billion euro. This explains the willingness of the government to invest in ICT research, and Big Data is a topic where mathematicians can come in on this. The Dutch research and development policy is focused a number of so-called top sectors, including water, energy and chemistry. Although neither mathematics nor ICT are defined as top sectors in their own right, they are of high importance to society. Indeed, without them none of the top sectors would function. But ICT being such a cross-cutting subject comes with the risk of not being taken seriously anywhere.
In 2014 a Top Team on ICT was established, TU Delft’s professor Inald Lagendijk is a member of this, to try and put ICT more in focus and improve funding for it. Among others, the Top Team drew up a ICT Human Capital Agenda and they wrote a white paper on Commit2Data. Commit2Data will focus on Big Data challenges throughout the top sectors.
There is a clear need for such a programme. We are facing huge challenges and changes, combined with huge opportunities. Every sector will be influenced by developments in Big Data. For example, the largest hotel and taxi companies in the world do not own hotels or taxis anymore, and the agriculture sector is quickly developing into a sensor-based smart farming industry. This means we urgently need improved skills for our industry and service companies. There are also still many challenges in Big Data research, including privacy, trustworthiness, completeness etc.
A number of calls will open soon in Commit2Data: Smart Industry, Energy Transition and Big data handling & Analytics. Calls on subject related to logistics, healthcare etc. and further activities are being prepared. The programme is not just about (funding for) research, but also about dissemination and creating economic opportunities. Hence, C2D aims to bring together Big Data oriented public-private partnerships of higher education, research institutes and businesses.
Agaath Diemel, Corporate Communicatie, TU Delft
Photografer: Marc Blommaert